Part of the section Dashboard is a powerful analytics tool, which collects your event data in real time and helps you evaluate your event from different aspects.
Based on your subscription, you can have different levels of analytics: Basic (all plans), Advanced (all plans), Professional (Enterprise plan only)
Basic Analytics
Subscription: available for all plans
Basic Analytics includes Analytics and Session insights
Analytics
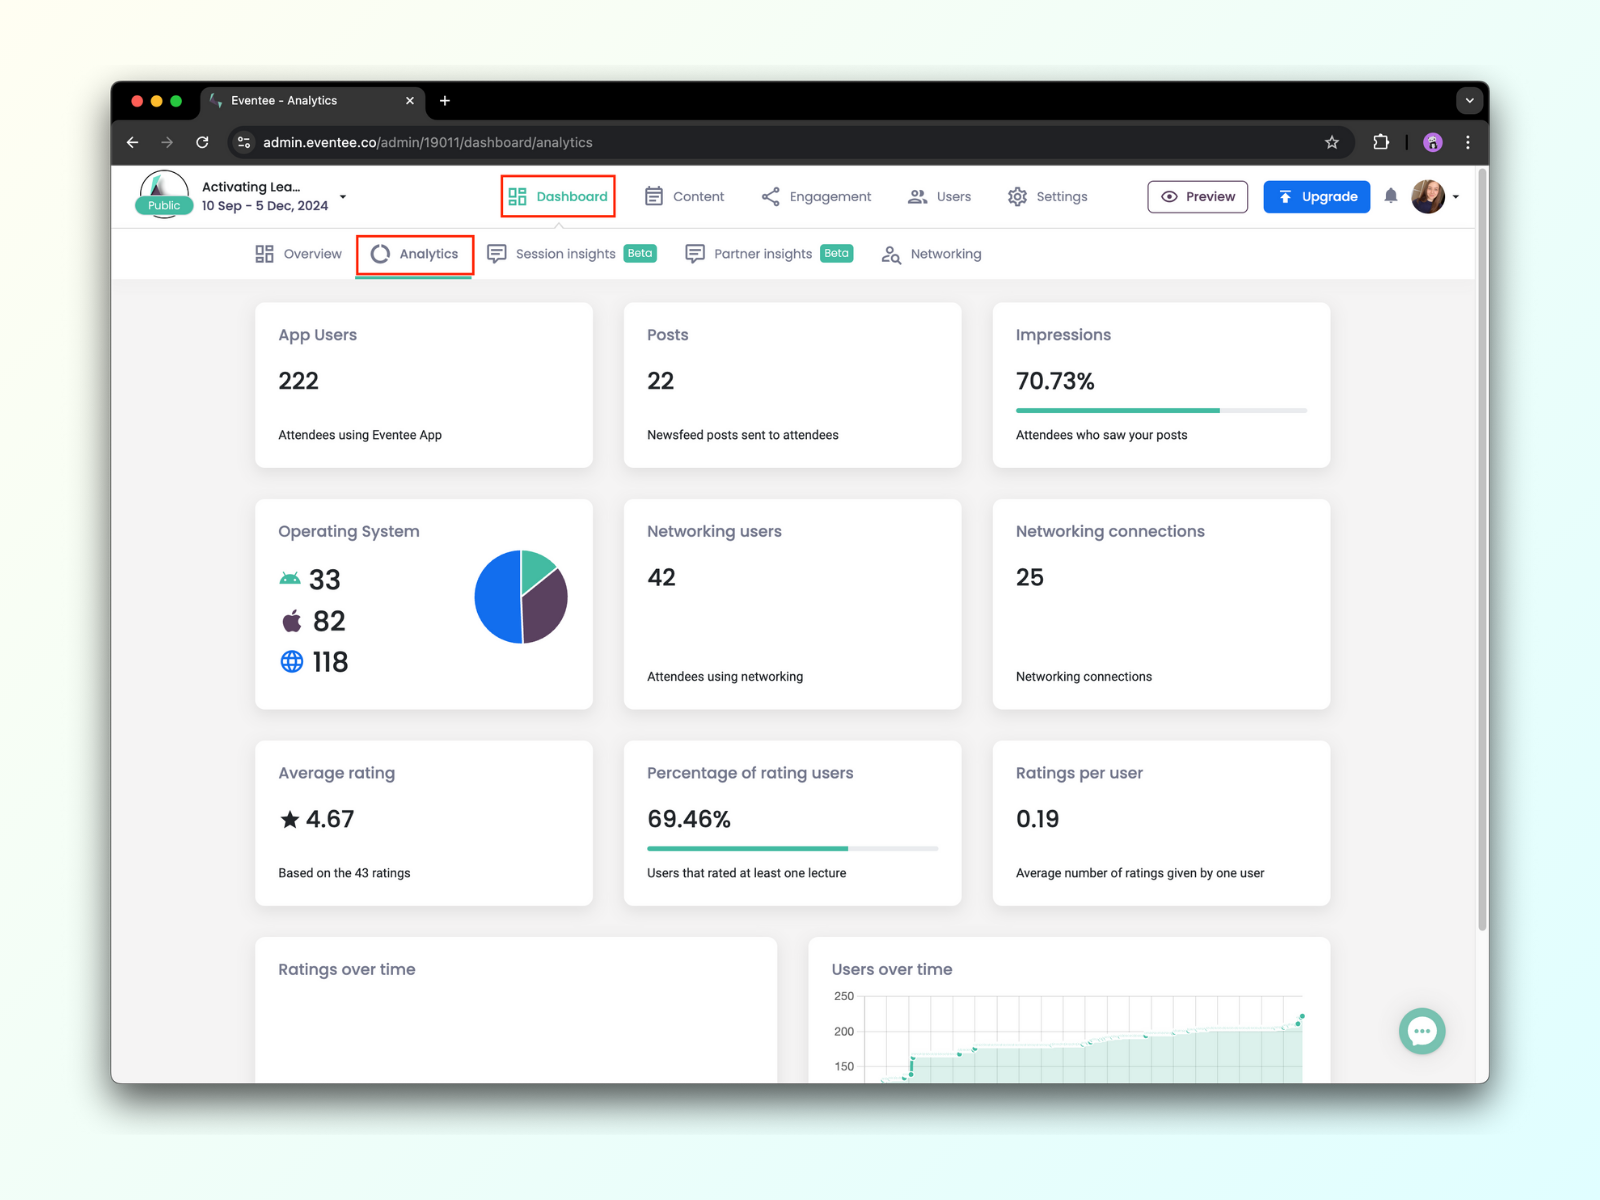
In the tab Dashboard → Analytics, you see the basic statistics of your event. You can observe:
App Users - Number of attendees using the Eventee app (overall number, not at this exact moment)
Posts - Number of Newsfeed posts sent by you or by other admins/moderators
Impression - Percentage of attendees who saw your posts
Operating System - Number of users using Eventee iOS, android or web app
Networking Users - Number of users connected to networking
Networking Connection - Number of matches among the networking users
Average Rating - The diameter from all ratings
Percentage of Rating Users - Users that rated at least one lecture
Ratings per User - Number of ratings per user
Ratings over time - A chart showing number of ratings over time
New users over time - A chart showing number of new users over time
You can, for example, evaluate, when your attendees use the app the most, number of feedbacks, used operating systems, etc.
Session insights
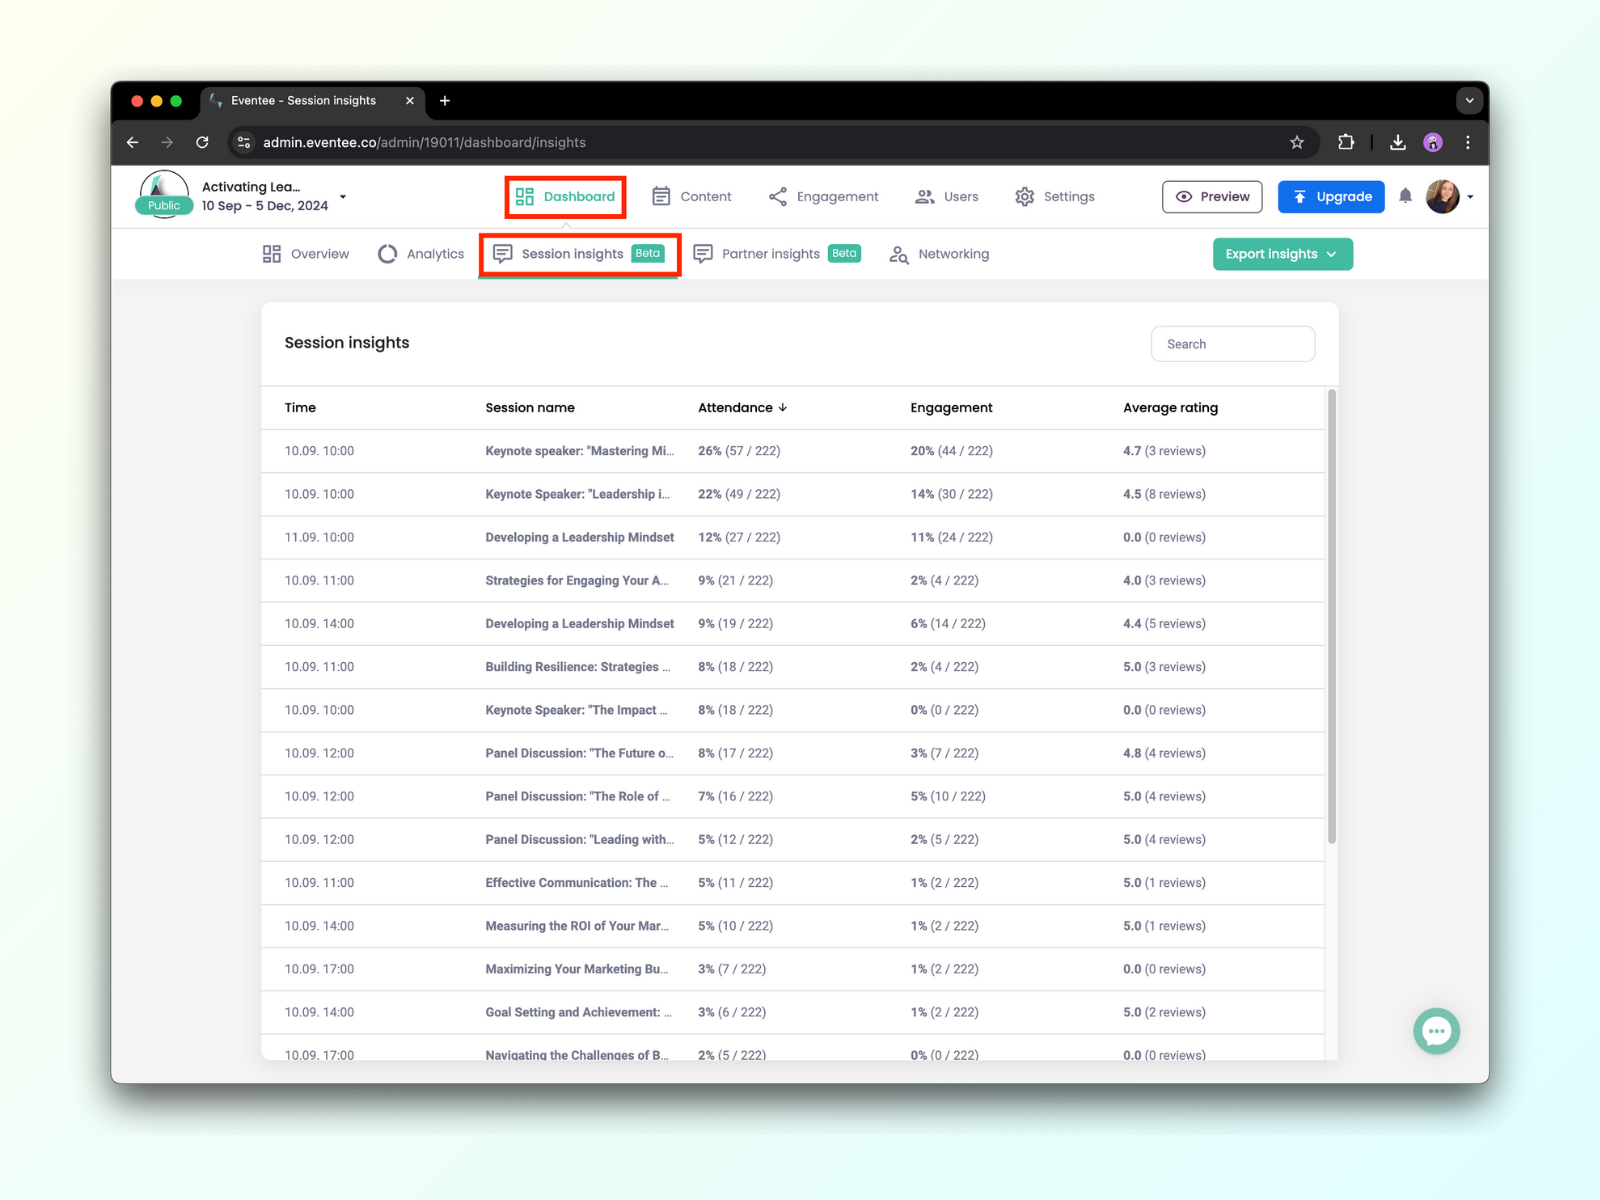
In the tab Dashboard → Session insights, you can see the basic statistics of each of your sessions.
Time - Session date and starting time
Session name
Attendance - Percentage of people who joined the session (out of all event attendees)
Engagement - Percentage of people who engaged within the session (out of all event attendees)
Average rating - Average session rating and number of session ratings
Advanced Analytics
Subscription: available for Solo, Business, and Enterprise plan
Advanced Analytics includes Basic Analytics + Advanced session insights, Partner Insights, Networking Analytics and Google Analytics.
Advanced session insights
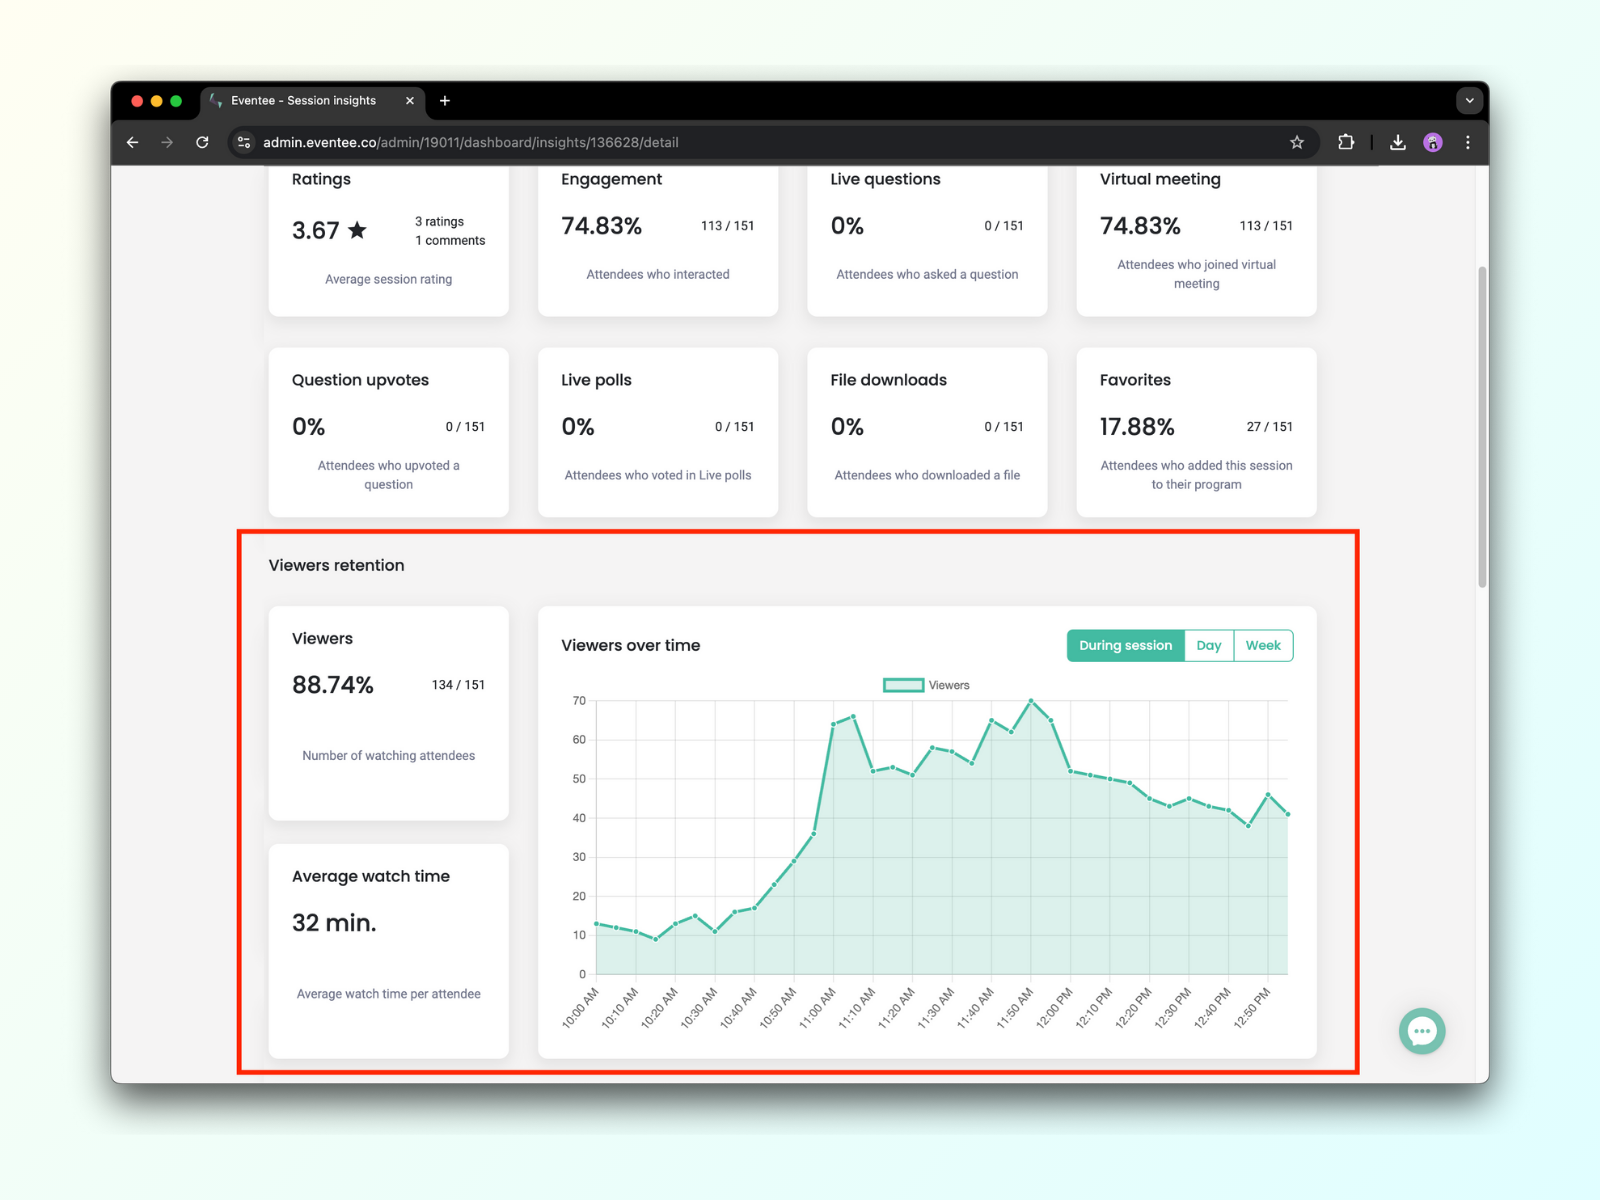
Go to the tab Dashboard → Session insights. There you will see the basic overview of your sessions. Find the session you would like to analyze and click to open the session details. The numbers refer to the chosen session and are calculated from the total number of attendees joining the event.
Ratings - Average session rating and the number of ratings and comments
Engagement - Percentage of attendees who interacted
Live questions - Percentage of attendees who asked at least one question
Virtual meeting - Percentage of attendees who joined the virtual meeting
Question upvotes - Percentage of attendees who upvoted at least one question
Live polls - Percentage of attendees who voted in Live polls at least once
File downloads - Percentage of attendees who downloaded at least one of your files
Favorites - Percentage of attendees who added the session to their personal agenda
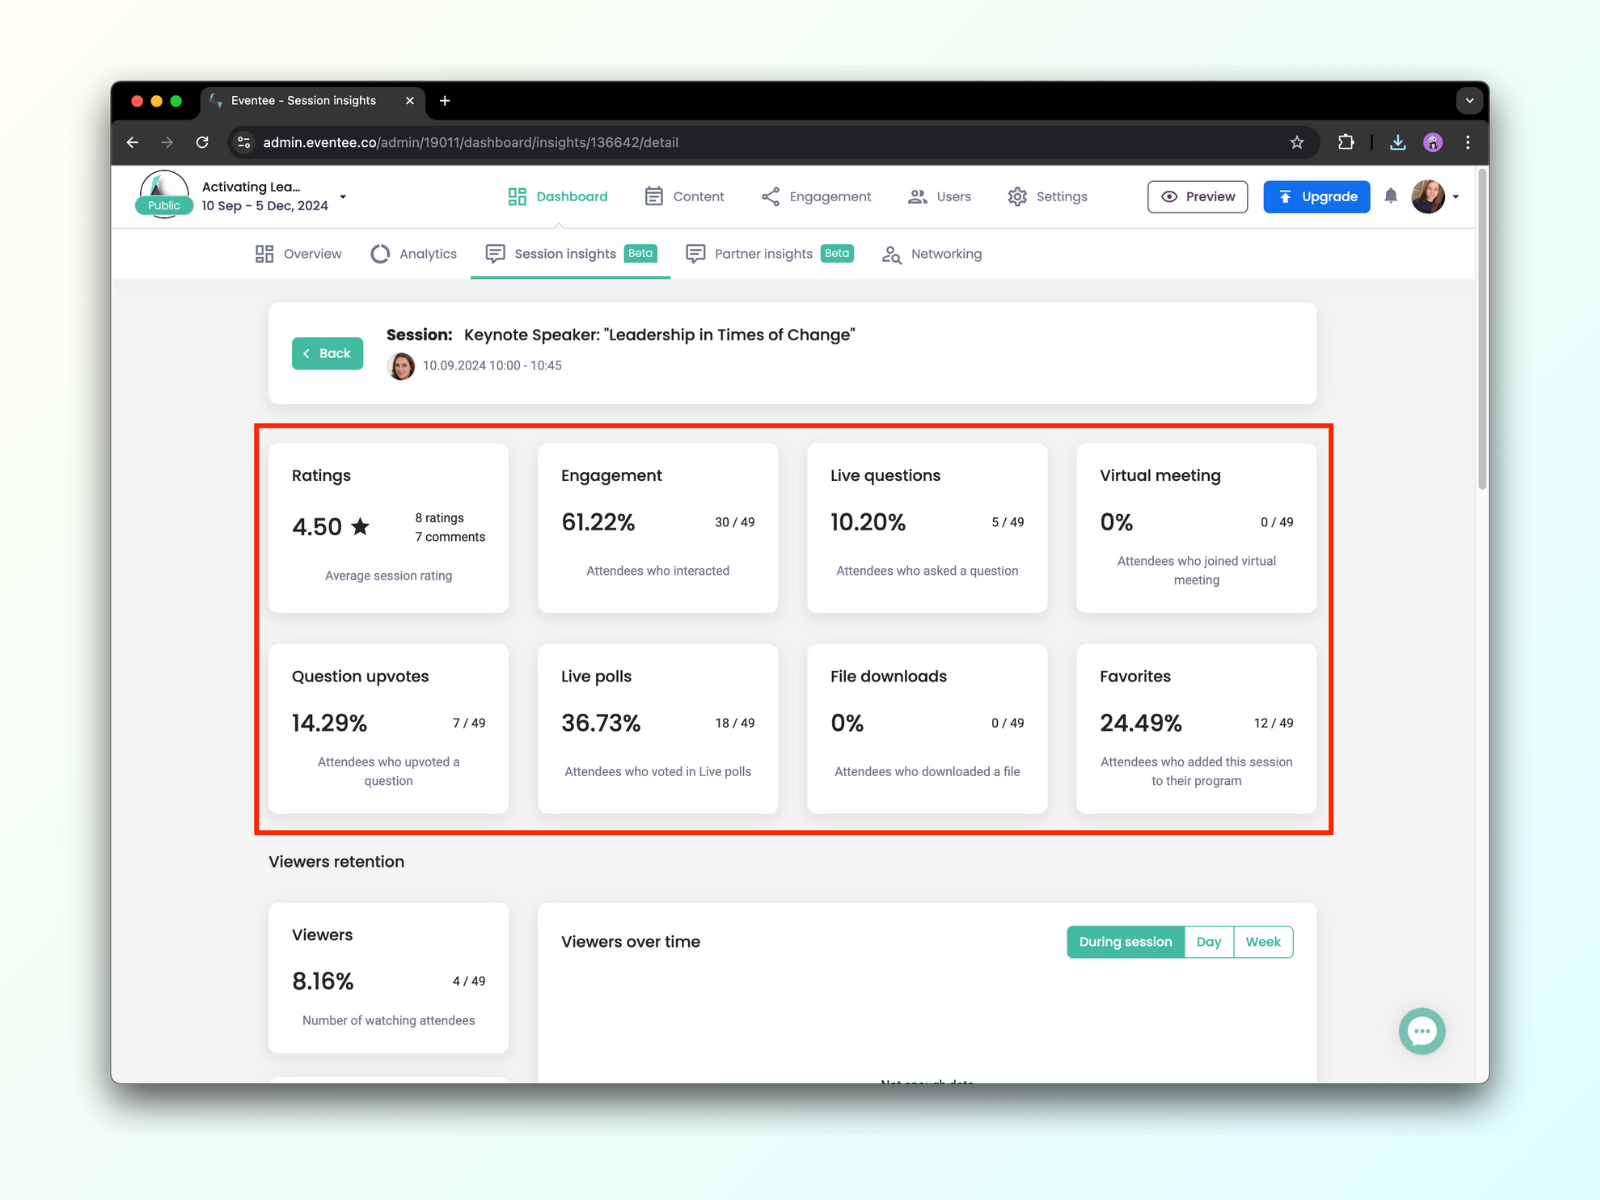
And for our virtual and hybrid event organizers, there's another section called Viewers retention. This section show how many people watched your session stream or video and the average time they spent on it. You can also observe viewers over time (during the session, in a day, or in a week).
Partner Insights
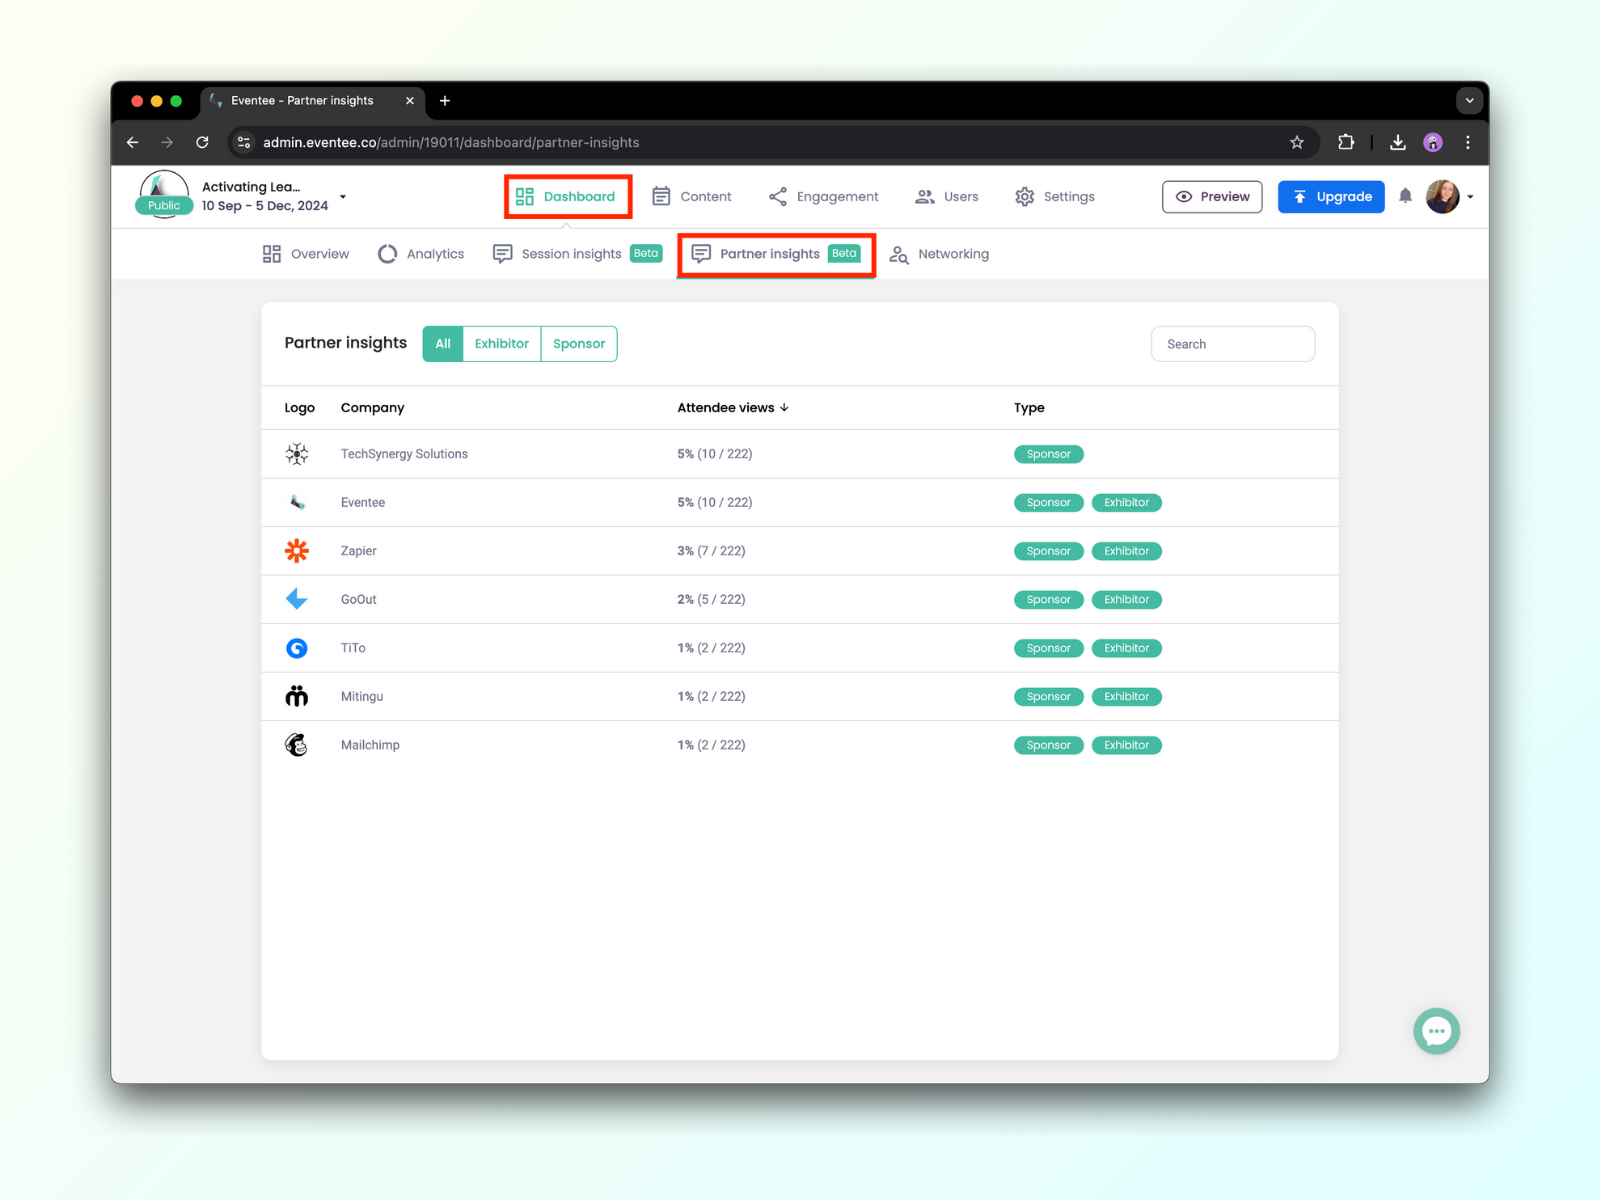
With Partner insights, you can find out how many attendees viewed each of the partners' profiles. Partners Insights are automatically set up once you create your partners and are located right next to Session insights.
Networking analytics
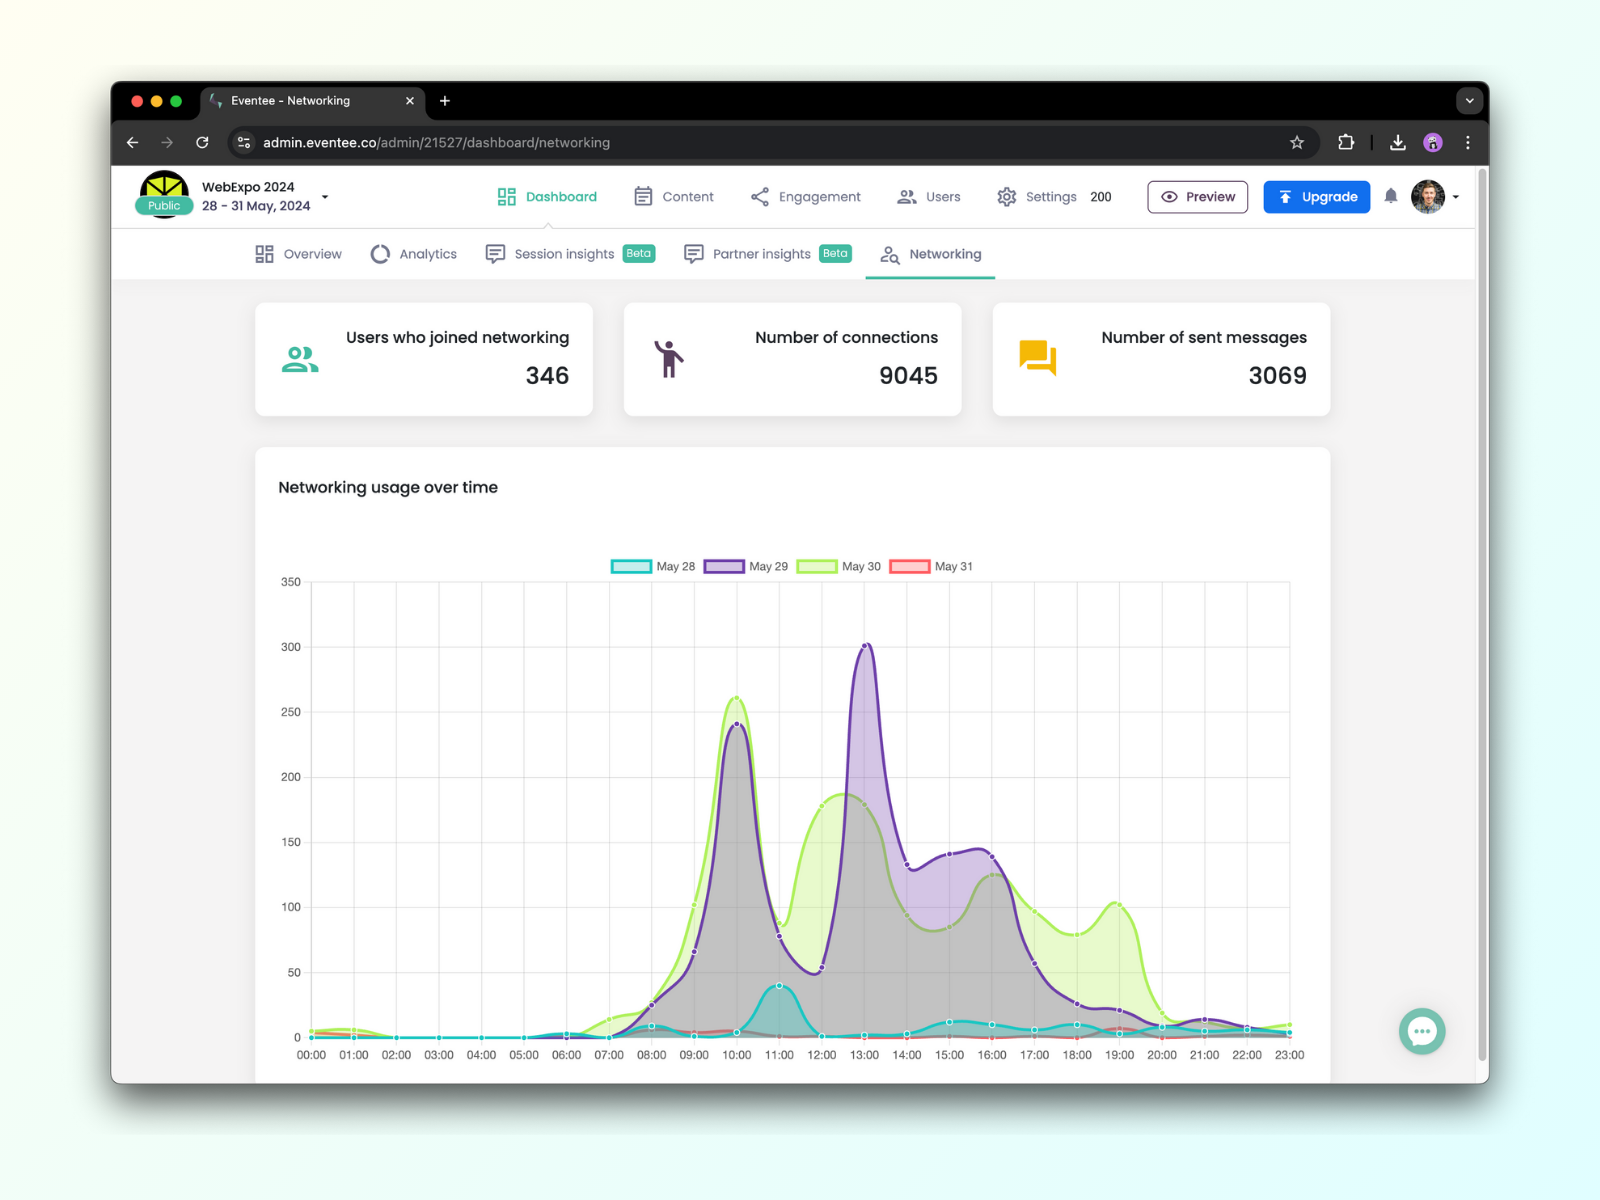
Networking analytics shows you how many users have joined the networking, the number of connections they made, and a total number of sent messages. You can also see the Networking usage over time in our easy-to-understand chart in which each color represents a different day.
You can find Networking analytics in Dashboard -> Networking.
Google Analytics
Eventee plans with Advanced and Professional Analytics also include Google Analytics integration. Here is how you set the Google Analytics integration to track your event landing page and web app.
Professional Analytics
Subscription: available for Enterprise plan
Professional Analytics includes Advanced Analytics + Attendee engagement analytics.
Attendee engagement
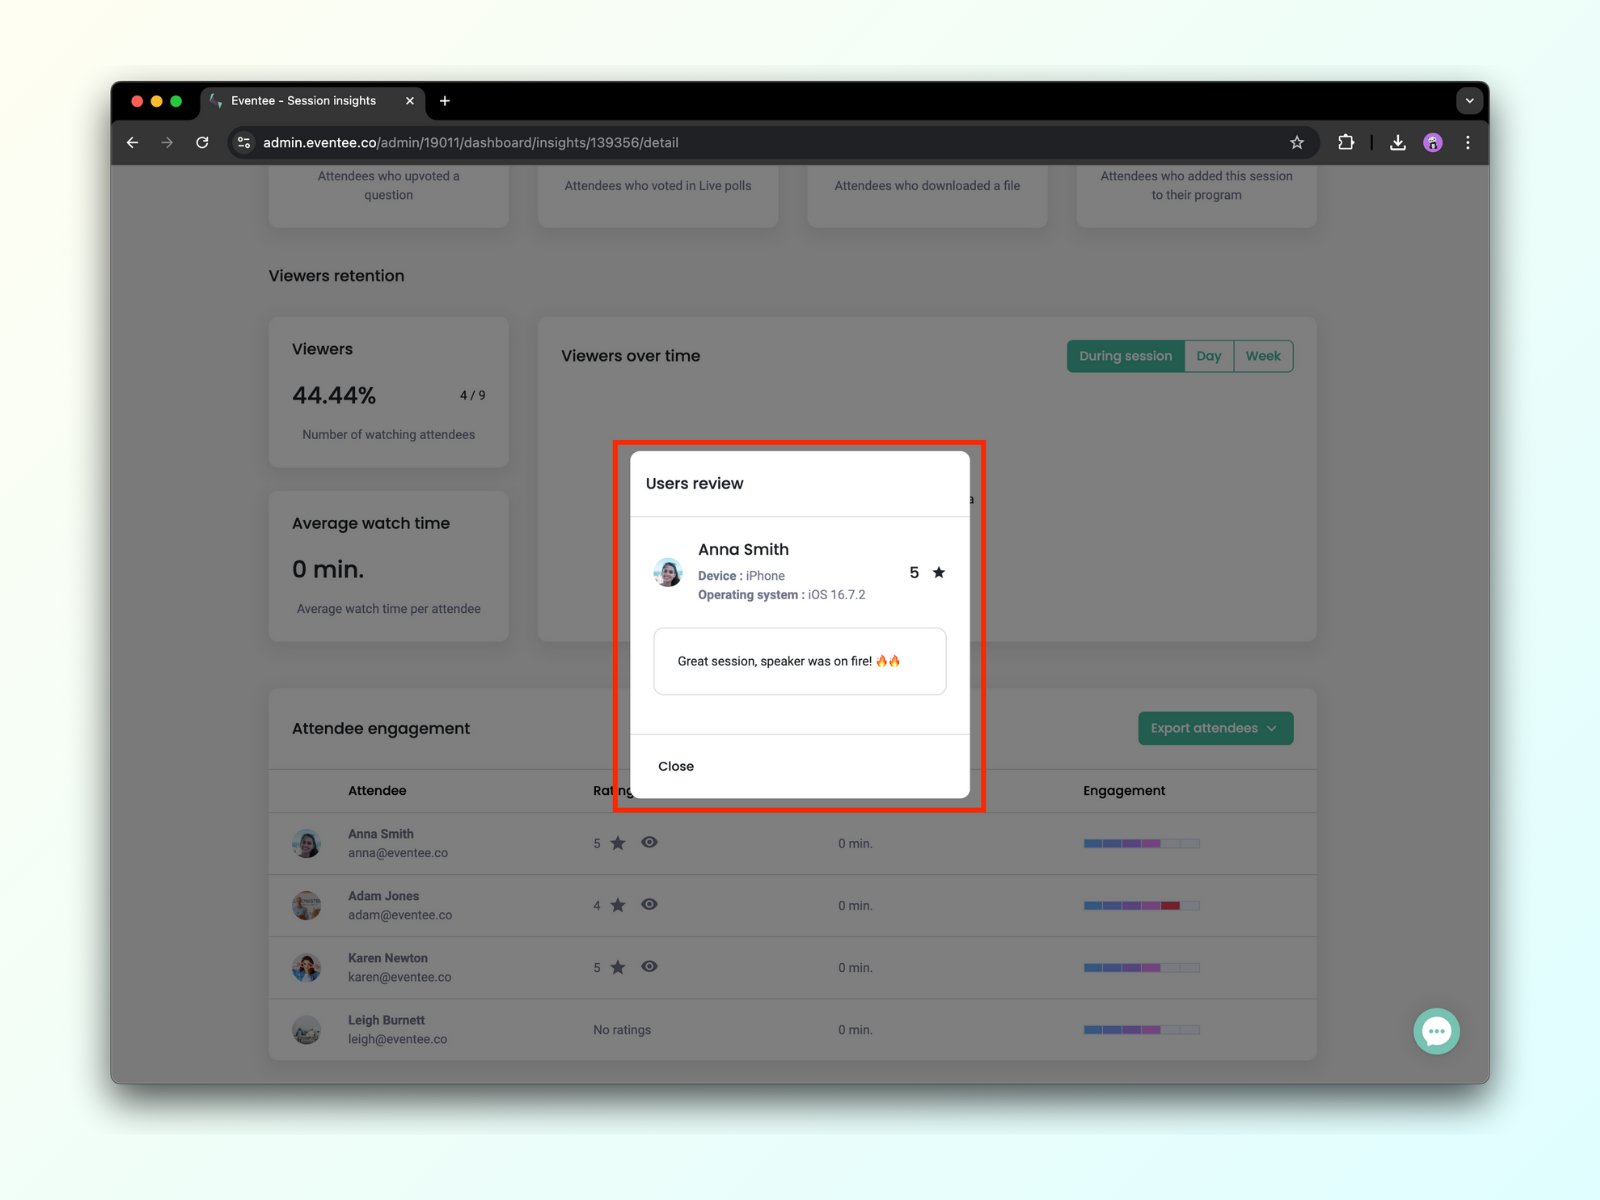
Attendee engagement is a section at the bottom of each Session detail analytics. It shows you how each attendee engaged with the session.
Here you'll find out their name and email, rating and comments, stream watch time and the level of their engagement, including information about specific engagement actions.
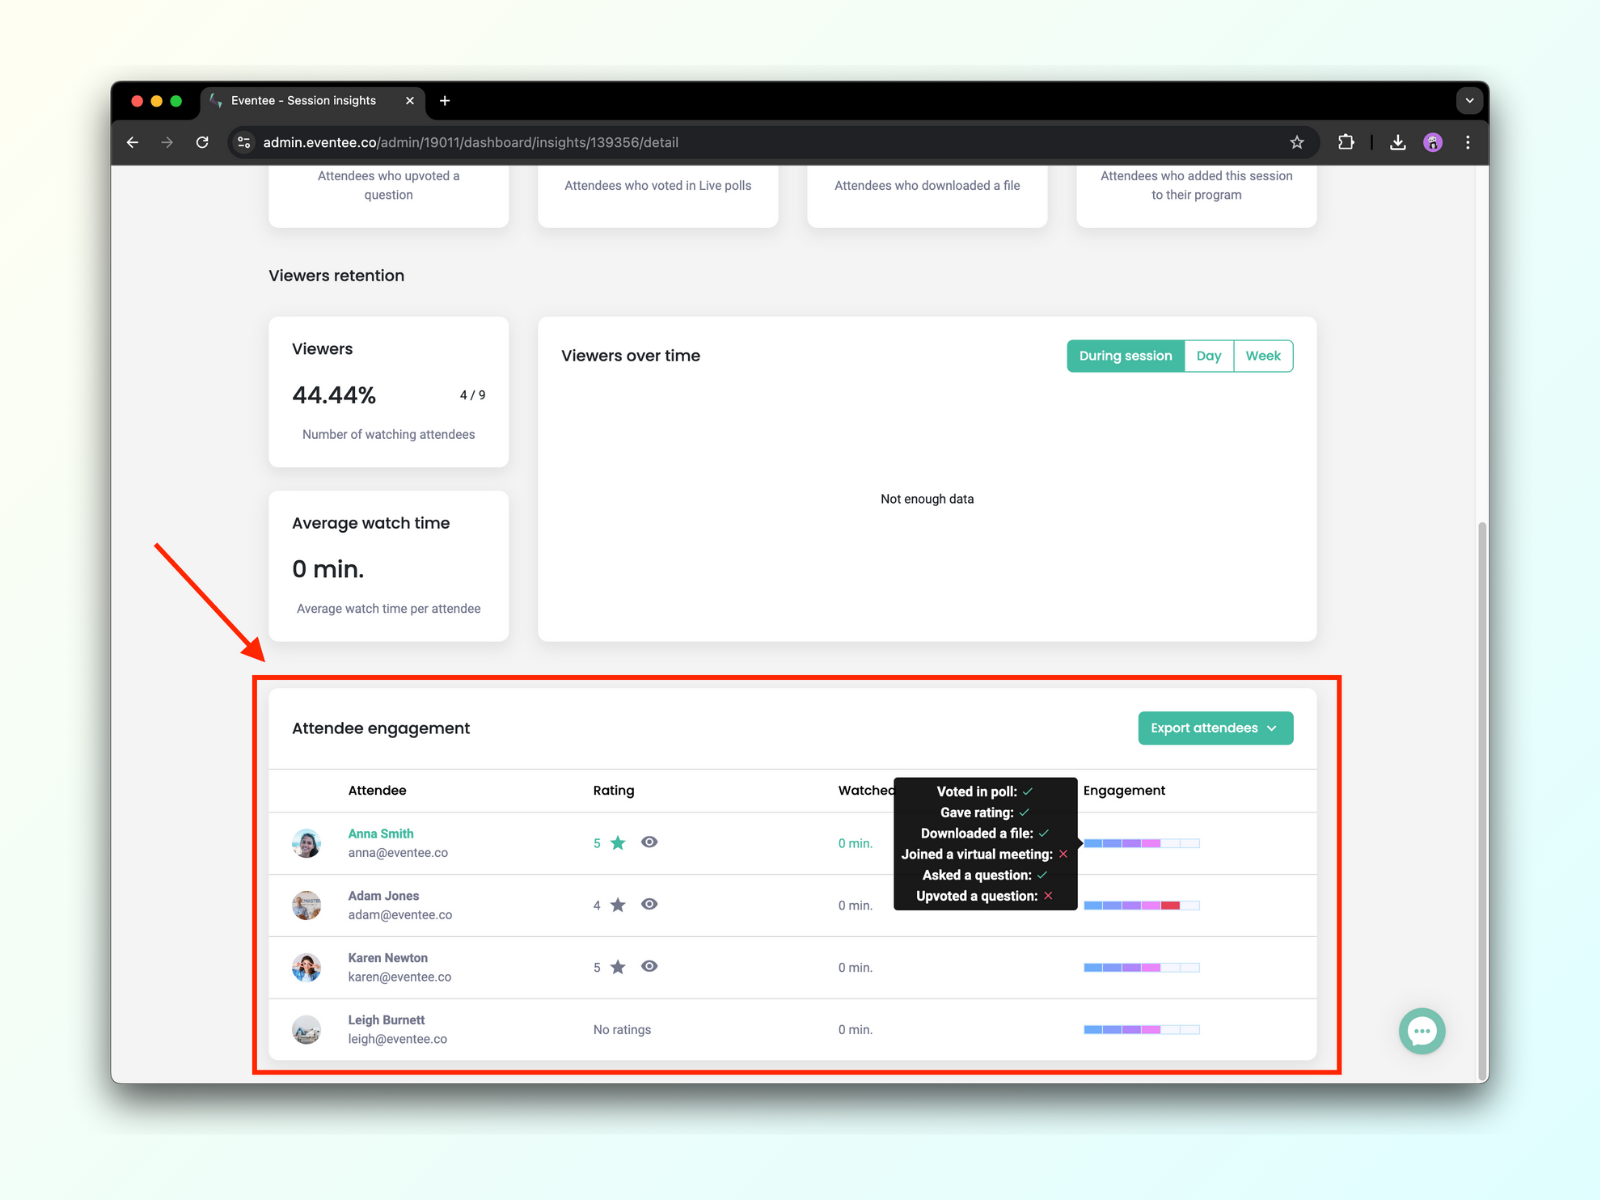
There are three main functions in the Attendee engagement section:
With the Export attendees button, you can export the whole Attendee engagement section as xlsx, csv or xls.
If an attendee gave a rating, you can click on the eye icon to see their comment, device, and operating system.
The Engagement column indicates what actions an attendee performed (marked with a check symbol). You can see the following six actions when you hover over the engagement scale:
Voted in a poll,
gave a rating,
downloaded a file,
joined a virtual meeting,
asked a question,
upvoted a question.
